
Website speed directly impacts sales – a single-second delay cuts revenue by 7%. Pingdom vs. WebPageTest are top tools for website speed testing.
Pingdom gives you uptime tracking and transaction monitoring for $42.12 monthly. WebPageTest focuses on detailed performance data across different browsers and devices.
Each tool serves specific needs – Pingdom tracks real user experiences across locations, while WebPageTest shows technical details about load times and page rendering.
This guide breaks down both speed-testing tools to help you pick the right one. You’ll learn about their testing locations, performance metrics, and pricing options to make the best choice for your website.
Understanding Pingdom and WebPageTest Basics
Pingdom and WebPageTest tackle website speed testing differently. Here’s what each tool does best.
Pingdom vs. WebPageTest: What Pingdom Test Does
Pingdom watches your website’s performance in two ways.
First, it creates fake visitor sessions across more than 100 global locations to check things like logins and shopping carts. Second, it tracks real visitors to show you exactly how your site performs on different browsers and devices.
The tool looks at everything from DNS lookup speed to how content loads on your pages. Pingdom runs these checks from special data centers that cut out connection delays.
WebPageTest’s Main Features
WebPageTest started as Patrick Meenan’s project in 2008 before Catchpoint bought it in 2020. The tool stays open-source under the Polyform Shield license. WebPageTest shows you detailed data about:
- DNS lookup speed
- TCP connections
- TLS security checks
- Videos of your page loading
The tool groups its suggestions into:
- Making sites faster
- Better usability
- Stronger performance
WebPageTest runs checks using actual browsers and devices, showing you exactly what visitors see across different locations.
Pingdom vs. WebPageTest: Key Tool Differences
These tools work differently in five main ways:
Testing Setup: Pingdom uses super-fast data centers. WebPageTest copies real-world internet speeds to show more realistic results.
Server Network: Anyone can add their server to WebPageTest’s network. Pingdom keeps tight control over its 100+ test locations.
Test Details: WebPageTest digs deep into technical stuff like waterfall charts. Pingdom focuses on easy-to-use results from both fake and real visits.
Browser Options: WebPageTest works with lots of browsers – Chrome, Firefox, Edge, and Brave in different versions. Pingdom sticks to Chrome.
Test Control: WebPageTest lets you tweak many settings. Pingdom keeps things simple with fewer options.
These differences make each tool perfect for different jobs. Pick Pingdom for watching your site daily and understanding visitors. Choose WebPageTest when you need to fix technical problems or optimize your site’s speed.
Testing Locations and Server Coverage

Server location affects your website speed test results. Pingdom and WebPageTest use different server networks to check your site’s performance.
Pingdom’s Testing Network
Pingdom runs more than 70 global polling stations that test websites non-stop. The testing network covers five main areas:
- North America
- Europe
- Asia Pacific
- Latin America
- Default (North America and Europe combined)
When you pick a region, Pingdom picks 10 servers from that area to watch your site. For speed tests, Pingdom uses seven main locations:
- Tokyo, Japan (Asia)
- Frankfurt, Germany (Europe)
- London, UK (Europe)
- Washington D.C., USA (North America)
- San Francisco, USA (North America)
- Sydney, Australia (Pacific)
- Sao Paulo, Brazil (South America)
Pingdom’s data centers connect straight to internet backbones, cutting out connection delays. This setup lets them monitor sites from over 100 spots worldwide.
WebPageTest’s Server Setup
Since Catchpoint bought WebPageTest in 2020, the tool now tests from 30 different countries. Key test spots include:
North America:
- Dulles, Virginia (8,338 tests capacity)
- Salt Lake City, Utah (4,790 tests capacity)
- Los Angeles, California (8,339 tests capacity)
- Toronto, Canada (8,340 tests capacity)
Europe:
- Dublin, Ireland
- London, United Kingdom
- Paris, France
- Amsterdam, Netherlands
- Frankfurt, Germany (8,343 tests capacity)
- Milan, Italy
Asia-Pacific:
- Singapore
- Hong Kong
- Shanghai, China
- Beijing, China
- Seoul, Korea
- Tokyo, Japan (8,344 tests capacity)
- Sydney, Australia (8,345 tests capacity)
WebPageTest lets anyone add their server to the testing network. This means more test locations but different server speeds across spots.
Business users get special access to tests from mainland China, helpful for checking sites behind the Great Firewall. The public testing pool works well but might slow down when busy.
The API lets you run 200 tests daily, counting each page reload as a separate test. Test results stay available for 30 days – save them locally if you need them longer.
Speed Testing Metrics Comparison
Website speed numbers mean different things in Pingdom and WebPageTest. Here’s what each tool measures and why their results often differ.
Core Web Vitals Measurements
Core Web Vitals tell you how fast and stable your website feels to visitors. Both tools track these key metrics:
First Contentful Paint (FCP): The tools measure this the same way – when content first shows up on the screen.
Largest Contentful Paint (LCP): Shows when your main content loads. Google rates it:
- Good: Under 2.5 seconds
- Needs Improvement: 2.5 to 4 seconds
- Poor: Over 4 seconds
First Input Delay (FID): Measures how quickly your site responds:
- Good: Under 100 milliseconds
- Needs Improvement: 100 to 300 milliseconds
- Poor: Over 300 milliseconds
Cumulative Layout Shift (CLS): Checks if things jump around:
- Good: Under 0.1
- Needs Improvement: 0.1 to 0.25
- Poor: Over 0.25
Pingdom vs. WebPageTest: Load Time Accuracy
Pingdom and WebPageTest both measure load times, but they do so differently.
While Pingdom focuses on the onload time—when images and text are fully loaded—WebPageTest provides a more detailed analysis, capturing performance at various stages of the load process.
WebPageTest gives you two numbers:
- Document Complete matches Pingdom’s onload time
- Fully Loaded Time keeps checking for 2 more seconds
This explains why Pingdom usually shows faster times than WebPageTest. Sometimes Pingdom misses things like JavaScript sliders that load later.
Performance Scoring Differences
Each tool scores your site its own way:
Pingdom Looks At:
- Google PageSpeed rules for free users
- YSlow checks in paid plans
- Size of different parts:
- JavaScript
- Images
- Fonts
- HTML
- CSS
- XHR (Ajax)
WebPageTest Checks:
- Six special speed rules
- Technical stuff like:
- DNS lookup speed
- TCP connection time
- TLS security setup
WebPageTest’s Speed Index matches PageSpeed FID exactly, and its CLS uses the same scale as PageSpeed. Only WebPageTest tells you the total download size.
The same website often gets different scores:
- Pingdom: 2.18 seconds
- WebPageTest: 1.48 seconds
These differences happen because of:
- When tests finish
- How they copy real internet speeds
- Which server runs the test
- How they rank different speed parts
Real-World Testing Results
Your website speed affects visitor behavior – 57% of people leave pages that take over 3 seconds to load. Pingdom and WebPageTest show different speed patterns across various types of websites.
E-commerce Site Performance
Slow loading kills e-commerce sales. About 8% of shoppers leave because pages load too slowly. Even worse, 75% switch to competitor sites during busy shopping times rather than wait.
WebPageTest helps e-commerce sites through detailed waterfall charts that show:
- Which parts of your site cause delays
- How fast DNS lookups work
- TCP connection performance
- TLS security setup speed
Pingdom watches your key store features by testing:
- Shopping cart work
- Payment steps
- Login processes
Pingdom vs. WebPageTest: Blog and Content Sites
Content sites face their own speed challenges. Sites loading in 3 seconds instead of 1 second see:
- Bounce rates jump 50%
- Page views drop 22%
- Conversions fall 22%
WebPageTest records videos of your site loading. This helps you:
- See exactly what visitors experience
- Find jumpy content that frustrates readers
- Spot slow-loading sections
Enterprise Website Testing
Big websites need constant speed checks. Pingdom’s Real User Monitoring shows how your site performs across:
- Different locations
- Various devices
- Multiple browsers
Speed matters – 75% of visitors leave websites that take 4 seconds or longer to load. Each tool helps enterprise sites differently:
Pingdom Gives You:
- Non-stop synthetic testing
- Quick problem alerts
- Purchase path checking
- Location-based results
WebPageTest Provides:
- Deep technical analysis
- Custom test options
- Speed tracking over time
- Visual proof of problems
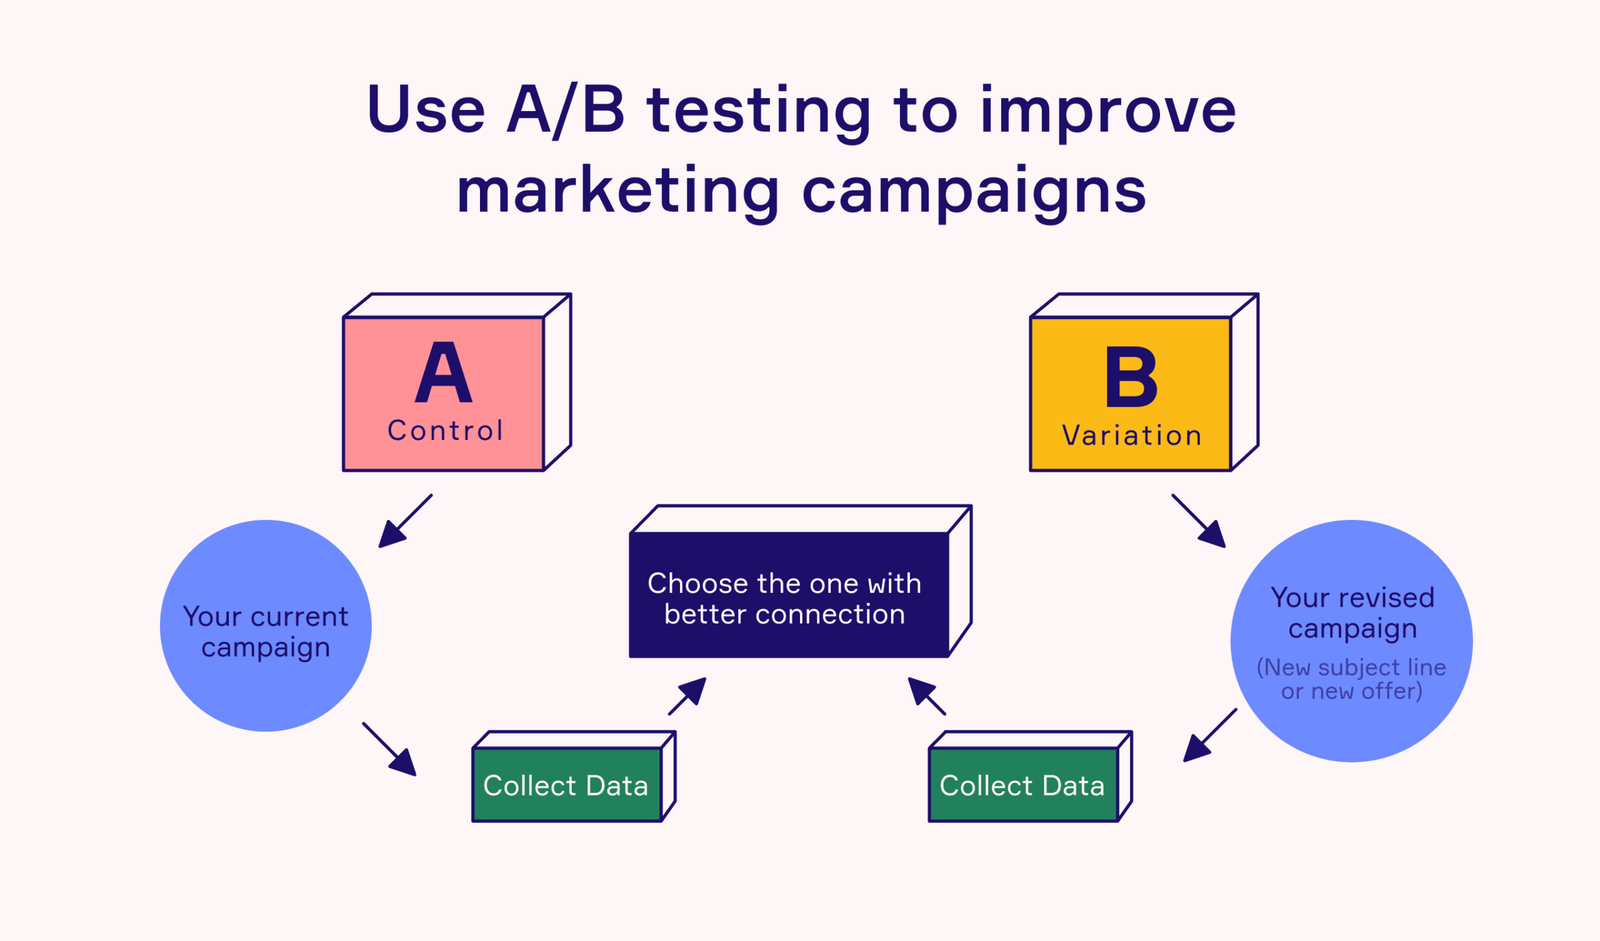
Regular testing becomes crucial after site changes. One phone company’s Google Page Speed score dropped 12 points just from adding A/B testing. This shows why you need continuous monitoring with both tools to keep your website fast.
Pingdom vs. WebPageTest: Pricing and Value Analysis
Picking the right tool means looking at what you get for your money. Here’s what Pingdom and WebPageTest charge for their features.
Pingdom Pricing Plans
Pingdom splits its service into different plans:
Standard Plan starts at $42.12 monthly:
- 50 uptime endpoint monitors
- 3 advanced monitors for the transaction or page speed
- Single user access
Advanced Plan costs $82.45 monthly:
- 80 uptime endpoint monitors
- 5 advanced monitors
- 3 user access
- 1 million real user monitoring pageviews
Professional Plan runs $228.25 monthly:
- 250 uptime endpoint monitors
- 25 advanced monitors
- 10 user access
- 5 million real user monitoring pageviews
Enterprise Plan uses custom pricing based on your website size. You get unlimited users and full monitoring features.
WebPageTest Cost Options
WebPageTest keeps things simple with three plans:
Free Starter Plan gives you:
- 300 monthly test runs
- 13-month test history
- All performance metrics
- Basic browser choices
- Standard speed tests
Pro Monthly Plan costs $18.75 monthly for:
- 1,000 monthly tests
- Premium test locations
- Fast-track testing
- API access
- Private tests
- Direct support
Pro Annual Plan saves money at $180 yearly ($15 monthly) with all Pro features included.
Pingdom vs. WebPageTest: ROI Comparison
Your return on investment depends on what you need:
Pingdom Gives You:
- Full monitoring package with synthetic and real user tests
- Shopping path tracking
- Quick alerts when things go wrong
- Public status pages
- Team access in bigger plans
WebPageTest Offers:
- Free plan with 300 monthly tests
- 13-month data storage
- Premium users skip the queue
- API for automatic testing
- Deep performance data
WebPageTest’s free plan works great for basic testing needs. Pingdom makes sense when you need constant monitoring with extra features.
Big websites benefit from Pingdom’s flexible pricing. Development teams often pick WebPageTest’s premium plans for the API access.
Pick your tool based on your needs:
- Simple speed checks? WebPageTest’s free plan works
- Full-time monitoring? Pingdom’s worth the cost
- Developer tools? WebPageTest’s API helps
- Enterprise setup? Both tools scale up well
Making the Right Choice
Picking between Pingdom and WebPageTest depends on what you need to test. Each tool works best for specific tasks.
Pingdom vs. WebPageTest: When to Use Pingdom
Pingdom stands out for businesses needing continuous monitoring and real-time alerts. The tool excels at:
Full Website Monitoring: Pingdom watches your site from more than 100 spots worldwide to catch problems in important tasks. Perfect for:
- Online stores tracking sales steps
- Websites checking uptime
- Apps needing instant alerts
Visitor Experience Tracking: Real User Monitoring shows exactly how visitors use your site across browsers, devices, and locations.
Business Operations: Pingdom’s special data centers cut out connection delays, giving you reliable speed data.
Best Uses for WebPageTest
WebPageTest works best for technical testing and custom setups. The tool shines at:
Complex Testing Tasks: WebPageTest handles tough jobs like:
- Testing multi-step processes
- Checking password-protected pages
- Watching checkout flows
Developer Work: WebPageTest gives developers tools to:
- Test different browser-device pairs
- Check site speed on various networks
- See detailed loading charts
World-Wide Testing: Testing from 30 countries helps you know how your site performs everywhere.
Choosing Your Tool
Look at these points when picking your tool:
Testing Needs:
- Quick checks? Pingdom shows fast results
- Deep testing? WebPageTest digs into details
Technical Skills:
- Pingdom fits teams wanting simple tools
- WebPageTest serves technical experts
Testing Setup:
- Need controlled tests? Pingdom’s network works best
- Want flexible testing? WebPageTest lets you pick locations
Money Matters [80,81]:
- Small needs? WebPageTest’s free plan gives 300 monthly tests
- Big operation? Pingdom’s full package pays off
Development Style:
- Building automated tests? WebPageTest’s API helps
- Watching site health? Pingdom alerts you fast
Many sites use both tools together. WebPageTest finds technical problems while Pingdom watches daily performance. Together, they catch speed issues before visitors notice them.
Quick Comparison Table
| Feature | Pingdom | WebPageTest |
| Main Features | – Fake visitor testing- Real visitor tracking- Uptime checks- Purchase path testing- Quick alerts | – Loading charts- Page load videos- Browser-device testing- Technical speed checks- Page part analysis |
| Test Locations | – 70+ test stations- 7 speed test spots- Special data centers- 100+ check points | – 30+ countries- Open server network- Different server types- China testing access |
| How Tests Work | – Data center tests- No delay setup- Chrome browser tests- Simple test options | – Real internet speeds- Speed limiting tools- Many browser choices- Custom test settings |
| Speed Checks | – Page load time- Core Web Vitals- YSlow tips- File size checks | – Page ready time- Full load time- Speed score- Technical details |
| Starting Cost | $42.12/month (Standard Plan) | Free plan availablePro plan from $18.75/month |
| Works Best For | – Non-stop checking- Big businesses- Fast alerts- Visitor tracking | – Developer testing- Technical checks- Custom tests- World-wide testing |
Conclusion
Pingdom and WebPageTest tackle website speed testing differently.
Pingdom watches your site 24/7 and tells you about problems right away. For $42.12 monthly, you get speed checks from special data centers that give accurate results every time.
WebPageTest shows you exactly why your site runs slow. The free plan lets you run 300 tests each month – perfect for development teams who need detailed speed data. Tests from 30 different countries show how your site performs everywhere in the world.
These tools measure speed differently. Pingdom looks at basic load time, while WebPageTest checks both when pages become usable and when they finish loading completely. This explains why you might see different numbers from each tool.
Pick your tool based on what you need. Want to know the second something goes wrong? Pingdom watches your site non-stop. Need to fix technical speed problems? WebPageTest shows you exactly what slows things down.
Many website owners actually use both – Pingdom for daily checking and WebPageTest for fixing speed problems. Together, these tools help keep your website running fast.